FOI Assessment
Concept
The spatial dimension and Feature Of Interest
Checks by Monitoring (CbM) introduced the concept Feature of Interest (FOI) to deal with the spatial aspect of the bio-physical phenomenon present on Earth. FOI is in fact the “space” occupied by the observable physical object on the ground, the “field”, and its spatial “footprint”. In the EU CAP context, it often coincides with the single unit of agricultural management (single crop or particular land use, on homogeneous agricultural land cover).
In the CbM system, the FOI has two spatial representations (features). The first is derived from the Geo-Spatial Aid Application (GSAA) and uses a polygon as geometric primitive. The second is derived from the Sentinel data and can be expressed in different “formats” - statistical metric, clusters of image pixels, image segments. Both representations serve to represent that single true physical object or FOI.
The information collected from Sentinel on a given FOI could reveal the presence or persistence of “things” of different nature inside. This could shed light on the characteristics of those bio-physical phenomena and their spatial distribution. It could also indicate whether the FOI representation from GSAA reflect the true physical object behind.
Spatial heterogeneity within the FOI representation detected by Sentinel signals, could relate to three cases:
Inherent and expected variations within the physical entity: A typical example is the pro-rata grassland where the herbaceous and woody land forms co-exist and form a stable “intrinsic mix”.
Alien physical entities present in the same unit of management: A typical example is the presence of an object of non-agricultural nature (for example buildings) within the FOI representation.
Several physical entities corresponding to different units of management: A typical example is the presence of arable land and permanent grassland within the FOI representation.
The latter two require particular attention, since they reject the initial hypothesis that:
the FOI representation from the GSAA relates to one and only one physical object,
this object is of agricultural origin (land cover);
and it is spatially congruent to both FOI representation (GSAA and Sentinel).
The validity of this initial hypothesis is an important boundary condition of the CbM, as it ensures that:
the area component - officially known hectares of agricultural land cover - provided by IACS, is correct
data derived from Sentinel is exclusively associated to the monitored physical object, which guarantees meaningful analysis and CbM decisions
The truthfulness of the FOI representation in relation to the actual FOI depends on the system design and quality of LPIS/GSAA datasets; the closer the representation to the actual FOI, the better the performance of any processing in CbM.
The importance of the spatial heterogeneity in the FOI and the spatial congruency of the FOI representations to the physical object on the ground, has triggered the design a special set of methods to detect and eventually quantify the spatial heterogeneity and congruency for CbM purposes. Since the spatial congruency of the FOI representation with the actual FOI is manifested through “one to one” cardinality between the representation and the true phenomenon, the term applied in the CbM is “spatial cardinality”, expressed with code G1. It is the first spatial type of information extraction in the CbM; a second, generic type of information extraction dealing with FOI heterogeneity, is called “spatial variability” and expressed with code G2.
Once integrated within the CbM, both G1 and G2 are expected to provide key information in the decision process. A confirmation of the “one to one” spatial cardinality (validity of the initial hypothesis) will confirm suitability of any given GSAA associated with the payments schemes as FOI representation for the CbM process. A rejection of the “one to one” spatial cardinality will require either
interaction with the farmer, when the GSAA-FOI cardinality is “one to many”; or
spatial aggregation process when GSAA-FOI cardinality is “many to one”.
The “spatial variability”, G2, in other hand, confirms the anticipated presence of heterogeneous properties within the physical object (pro-rata grassland, presence of landscape features) or the detection of the presence of multiple land uses within FOI, typical for the scenarios, related to greening payment scheme.

Figure 3: Illustration of the “spatial congruency” in the context of CbM
Methods and algorithms
GTCAP launched a series of activities to develop and test different methods for the detection of the spatial cardinality and spatial variability within the FOI representation. There were three phases:
Elaborate several methods using different Sentinel signals, at the level of Proof of Concept;
Test the performance of the developed prototypes;
Select and compile the most successful methods in python scripts.
A tiered-approach for the development of the method was established, with the aim to cover both spatial cardinality (G1) and spatial variability (G2); with the former considered to be a special case of the latter. For spatial cardinality G1, there were two sub-cases identified depending on the severity of the spatial mismatch between the FOI representations. The approach comprised the following three steps (tiers):
Step 1: Search for “different things” within the FOI representation from GSAA – spatial variability (G1)
Step 2: Search for “different physical entities” that invalidate scenario – spatial congruency (G1) not respected to a degree that it jeopardizes the Sentinel signal with a given scenario
Step 3: Search for “alien entities” big enough to invalidate the area – spatial congruency (G1) not respected to a degree it jeopardizes the area component as provided by IACS.
The implementation of step 3 certainly required a numeral for the size of the different physical entities within the FOI representation, beyond which the area component would be jeopardized. Based on earlier technical research and following the logic applied in the LPIS update, it was agreed that occurrence of continuous clusters with more than 20 pixels within the FOI representation indicate the presence of physical objects big enough to challenge the area component provided by IACS. The pixel size and thus final area depends on sensor used. More information on the subject is provided in a separate technical report.
For the G1 method, further assumptions have been made on the detection of “one to many” cardinality.
persistence on the ground for sufficient time to invalidate the given scenario.
manifestation through the presence of entities having different behaviour in time.
distinct behaviour can be captured by the Sentinel signal.
These different entities are sufficiently large in image cluster size to challenge the area component.
Although the G1 methods were designed to detect issues with the spatial congruency, the ultimate outcome was a confirmation of the validity of the FOI with respect to:
the “officially known area” and the type of agricultural land cover recorded in IACS;
correspondence of graphical representation of the FOI (one-to-one spatial match with reality or correct portion of larger unit)
In phase 1, five methods were developed and four were tested:
Analysis of S1 backscattering’s speckle noise: Takes into consideration that in homogeneous fields the SAR backscattering speckle is following a Gamma distribution
Threshold on S2 signal-to-noise ratio: Uses the ratio between the observed NDVI average and observed NDVI standard deviation
Histogram analysis of S2 signal: Monitors the difference in 25 and 75 percentile values relative to the mean of the histogram
Unsupervised clustering through S2 image segmentation: Looks for clusters of pixels (grouped in segments) with distinct behaviour in time
Multi-temporal S2 supervised classification: Assesses the land cover types found within the FOI representation derived from pixel-based supervised machine learning
More information on these methods is documented in a separate technical report in progress.
Test results
In phase 2, all methods were run on a pre-defined test area in Catalonia (Spain) with GSAA data from 2019, where relevant Sentinel CARD products (Copernicus Application Ready Data) were available for both Sentinel 1 (S1) and Sentinel 2 (S2), with sufficient temporal density.
The setup for evaluating the results was based on the conceptual elements, incorporated later on in the Technical Guidance on QA CbM (v.1.0). 365 randomly selected FOI representations from 2019 GSAA were visually checked (with optical Sentinel data) for presence of spatial variability and the spatial cardinality issues over time, and at regular intervals, depending on the land cover type given in the GSAA. These checks were made before running the methods and can be considered completely “blind” (not biased by the outcomes from the different methods).
The comparison of the results from the methods with the collected ground truth provided a diverse picture, with no standalone method scoring sufficiently well for both commission and omission errors. Methods seem to be complementary rather than competing, each revealing different aspects of the observed phenomena.
The particular LPIS design (based on cadastral parcel) and the rugged landscape in Catalonia was another important factor that adversely influenced the performance of the methods. Detection performance varied also depending on the type of observed agricultural land cover. Yet, the clustering methods seemed to score better in comparison with the two statistical methods.
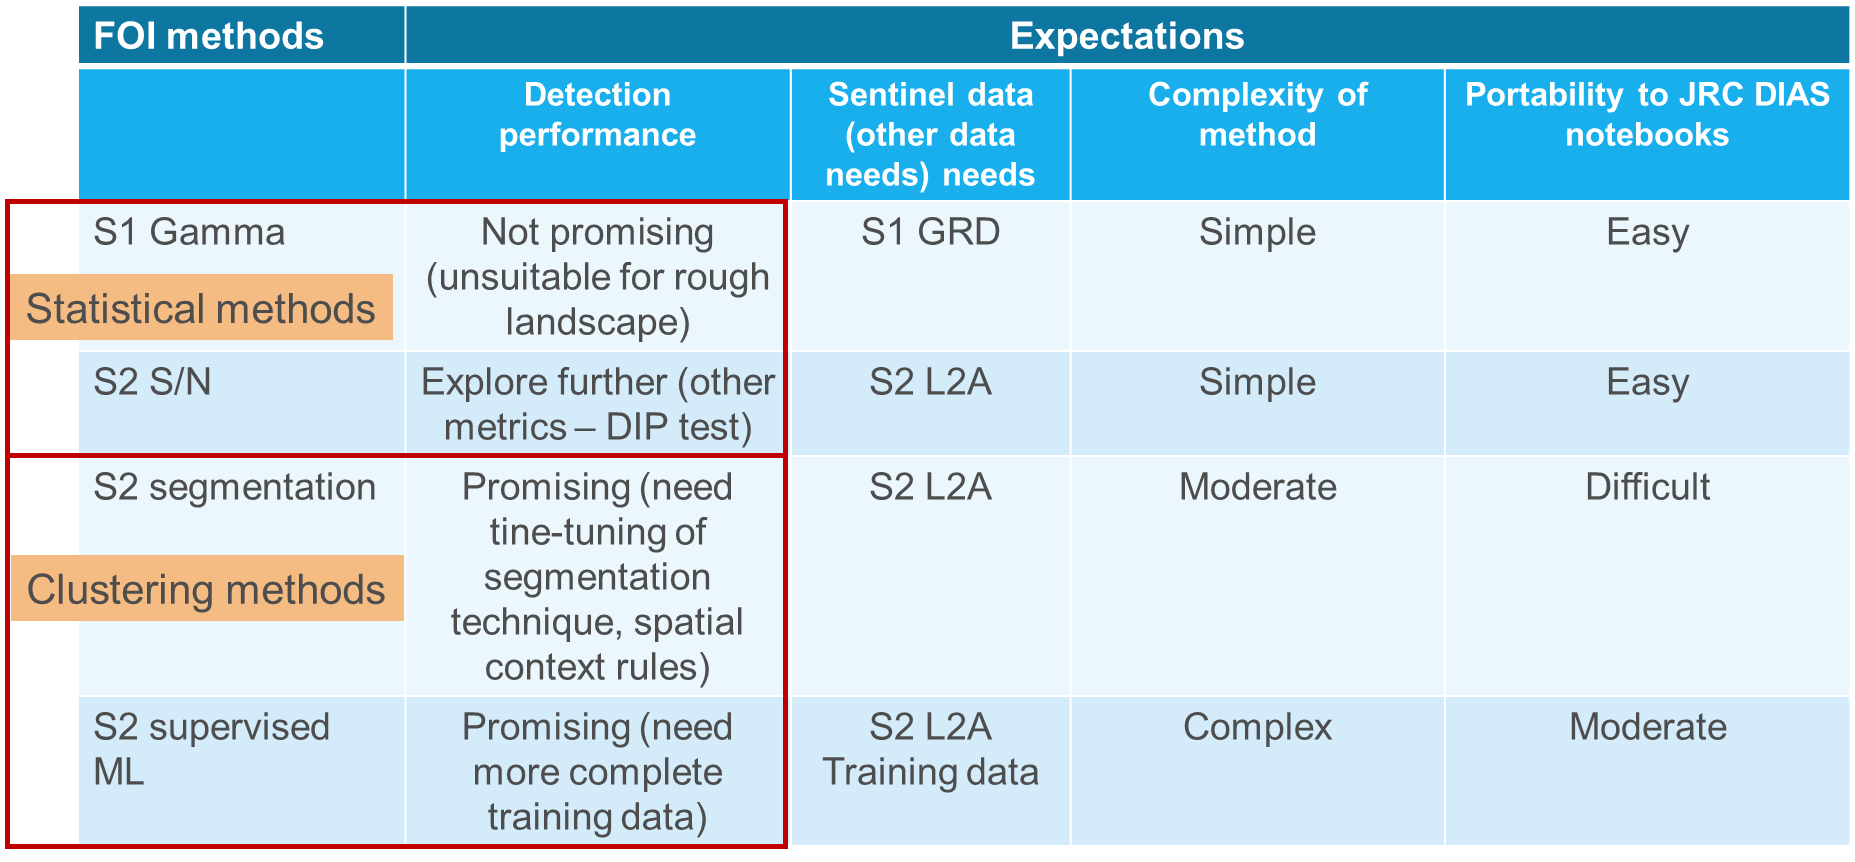
Figure 4: Overview table with the methods tested (the histogram analysis method is missing, since it was not subject to this evaluation)
The results also provided useful insights of certain methodological and technical challenges related to the (weather) cloud cover filtering, the appropriateness of the statistical methods, the parameters of the segmentation process, the completeness of the training data and the need for introduction of elevation data (DTM, DSM).
A promising discovery from the quality assessment was the fact that the majority of the observed “FOI inconsistencies” were visible already by the month of May, which is still within the GSAA application period. This suggests that both G1 and G2 detections could and probably should be incorporated as supporting tools during the declaration process to help farmers improve their GSAAs.
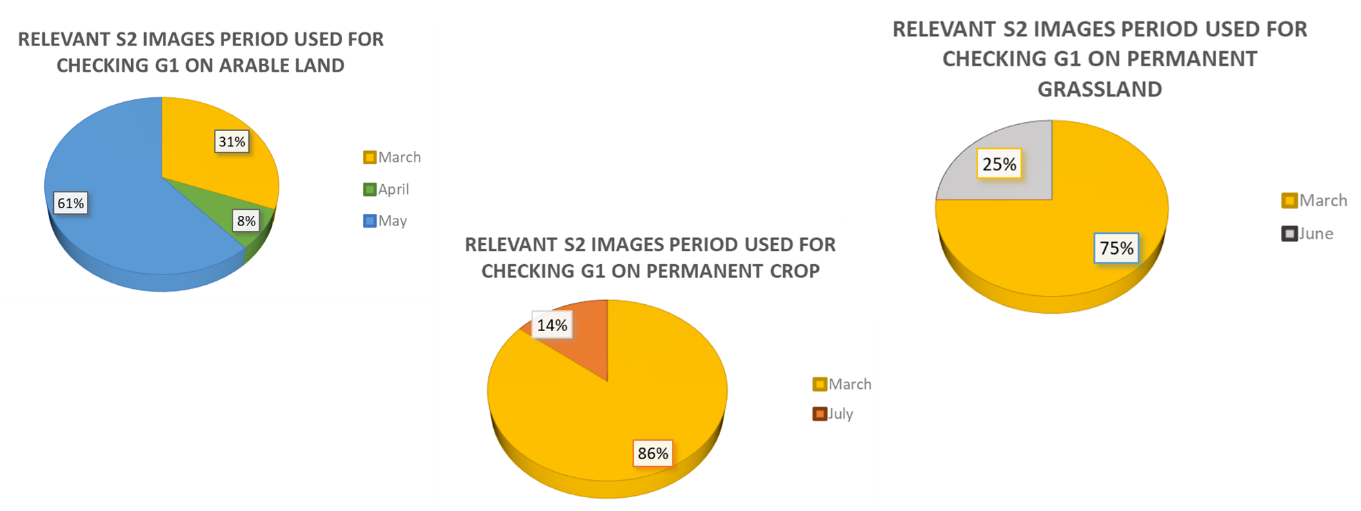
Figure 5: Relevant period for the detection of issues related to spatial cardinality (G1), as collected for the validation dataset in Catalonia (Spain)
Cardinality
Towards a spatial cardinality, G1 code example
The main conclusion of phase 2 was that clustering methods were more promising and, in fact, essential for the detection of issues in relation to FOI spatial cardinality. However, both the segmentation and supervised classification needed additional tuning. GTCAP decided to invest, in phase 3, in the development of generic “best practice” python scripts for the detection of clusters within FOI representation, provided by any thematic raster. A prototype of such python module already existed as part of the supervised machine learning method.
This resulted in the so-called “FOI assessment python module” that combined these methodological elements:
Cluster assessment within FOI relies completely on information provided by thematic raster
Focussed exclusively on detecting, whether GSAA ⊂ > FOI (GSAA split case)
Assumption that the CbM signal alone is used to capture distinct cluster behaviour
Deals with GSAA FOIs having cluster representation of at least 40 pixels
Does not (yet) apply negative buffer prior to cluster assessment
Customizable to address both G1 and G2 aspects
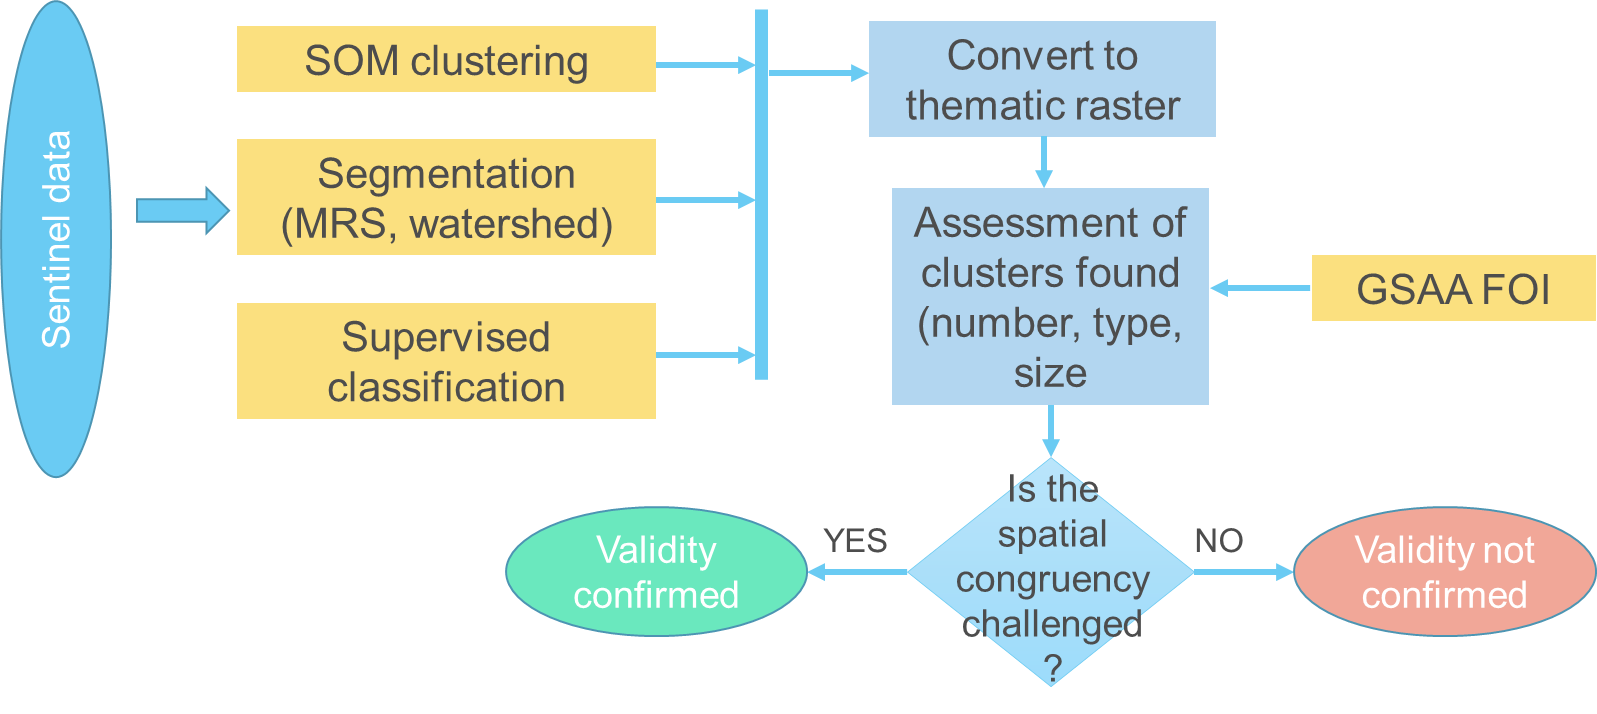
Figure 6: Workflow of the FOI assessment python module
The cluster assessment python module is being tested with thematic raster data generated from the unsupervised image segmentation method (both in Catalonia, ES, and Belgium-Flanders). Although having relatively high commission errors for the spatial cardinality, this segmentation method proved to add value by detecting variabilities within the FOI, such as terraces, landscape features and shrub encroachment within natural grasslands – all very relevant in the context of compliance scenarios that cover CAP greening aspects.
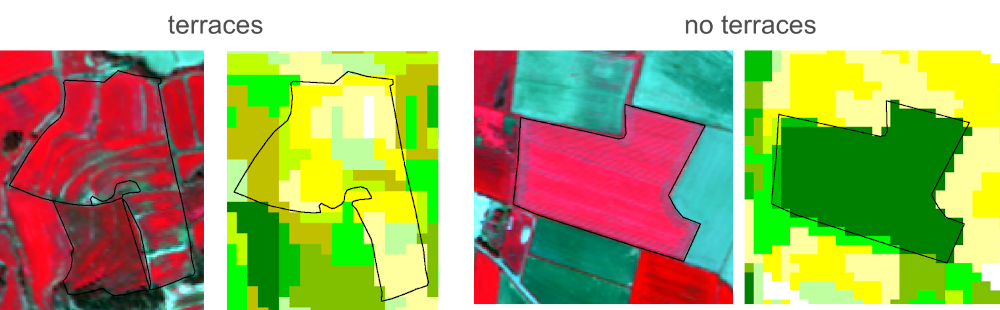
Figure 7: Parcels with terraces results with more images segments than those without (JRC Study case in Catalonia, ES)
The python module also supports an “enhanced” version of the “histogram analysis” method. It monitors the pixel value distribution of the NIR and RED bands of Sentinel-2 and compares them to a uniform or normal distribution. Although not yet formally evaluated, some initial trials evidence its ability to detect heterogeneous FOI representations. The algorithm is fully automated, easy to deploy, and generates both indices and image chip highlights.