Calendar view
1. Introduction
The “calendar_view” python package provides a set of functions that allows one to download, process and display Sentinel-1 and Sentinel-2 data products. The package is designed to operate on “parcels” provided as input in a ESRI shape file. Sentinel-1 and -2 data are extracted for the specific parcels and are displayed in a “calendar view”, which has been designed and optimized to provide an immediate and intuitive access to both temporal and spatial dimensions of Sentinel-derived data.
While the scripts exploit the RESTful APIs developed by the JRC D5 unit to download raw Sentinel imagettes tailored to the extent of the parcels provided as input, the code is general and can be easily adapted to work, for example, on geotiff downloaded from other sources.
2. Dependencies
The calendar view script depends on several standard python libraries that can be found in the requirements.txt file. The dependencies can be installed with:
pip install -r requirements.txt
As well the gdal_merge.py module that can be download from https://github.com/geobox-infrastructure/gbi-client/blob/master/app/geobox/lib/gdal_merge.py and should be added to the utils folder.
2.1 Calendar view Modules
The script can be launched from the “calendar_view_gui.ipynb” Jupyter notebook.
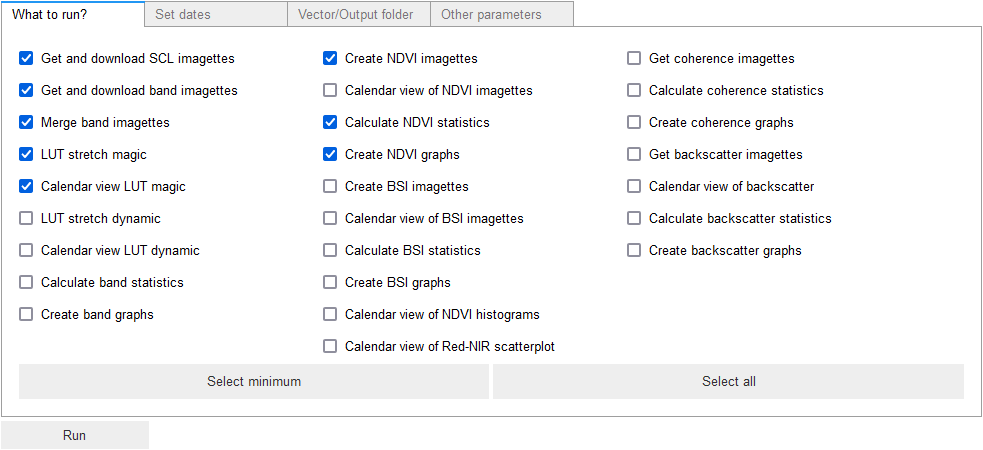
On the first tab of the GUI you can select the products that you want to produce:
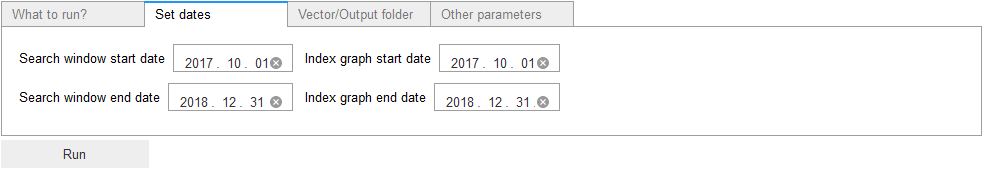
On the second tab of the GUI you can set the date range for data download and visualisation:
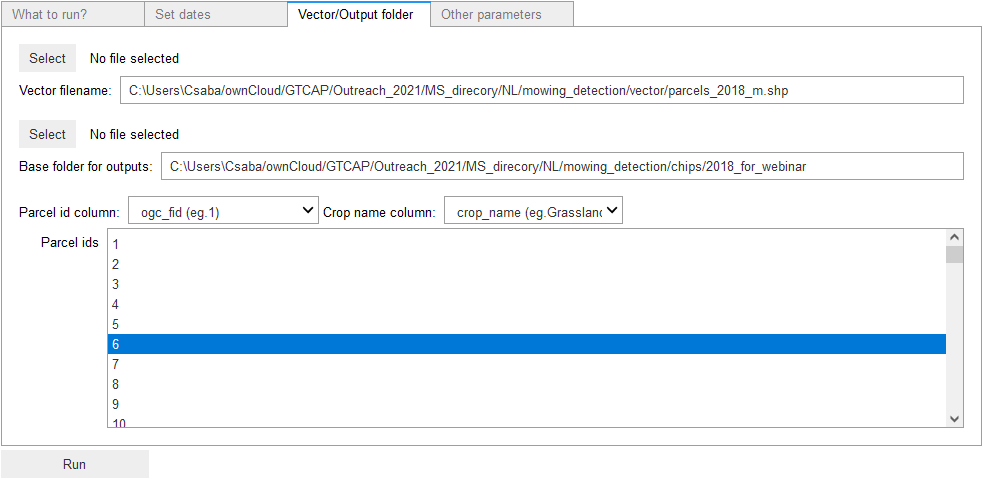
On the third tab of the GUI you can define the ESRI shapefile with the parcel polygons (“Vector filename”), you can select the folder for the outputs produced by the script (“Base folder outputs”), the attribute table column holding the parcel ids (“Parcel id column”) and the attbibute table column holding the crop names (“Crop name column”):
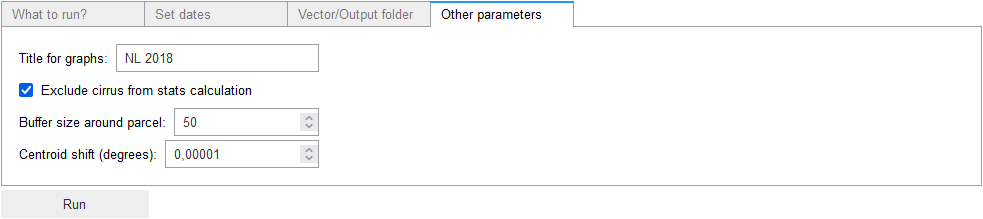
On the forth tab of the GUI you can define all additional parameters, such as the title for the time series graphs, whether to include or exclude the cirrus cloud mask from cloud cover calculations, the buffer size around the parcel for chip extract (in meters) and the potential shift of the parcel centroid in degrees. (This latter can be useful when you want to make sure the image chips are re-generated and not read from the cash):
The following custom modules for the calendar_view package are called by the run_calendar_view_from_jupyter.py script:
batch_utils: provides general functions for the processing of parcels and Sentinel data. The set of functions provided in this module allows the selection of parcels, the determination of the list of imagettes to be downloaded on the basis of cloud mask criteria, the download of imagettes, processing of Sentinel data including image color stretching (lookup table stretch or LUT stretch)and computation of derived indexes such as NDVI and NDWI. For download operations, the module uses the functions developed under download_utils.
download_utils: module for downloading and processing Sentinel-1 and 2 imagettes.
plot_utils: functions for plotting Sentinel-1 and 2 imagettes in structured calendar views. Sentinel products are displayed in a coherent way, in order to provide an enhanced accessibility to both temporal and spatial dimensions of Sentinel-1 and 2 products.
graph_utils: module providing functions for displaying and plotting temporal profiles such as NDVI and NDWI. The module focuses on temporal (1-D) signals and complements the utilities in plot_utils, which focuses on displaying images (set of 2-D signals).
extract_utils: module for the calculation of the NDVI and NDWI indexes. The functions in this module are called by batch_utils.
The call graph of the run_calendar_view script is provided in the figure below.

3 Structure of the code
The run_calendar_view script is organized in two main parts: the initialization block and the main processing loop. The input parameters and processing settings are defined in the initialization block whereas the actual processing is performed in the main loop that performs the different tasks by considering individual parcels. The main processing loop is further divided in two parts: download and processing of Sentinel-2 data and download and processing of Sentinel-1 data. The overall structure of the script and the different tasks performed by the main processing loop are illustrated in Figure 2. The different parts of the script are better detailed in the following sections.
Overall structure of the run_calendar_view script.
run_calendar_view
Initialization:
Authentication and RESTful API access
Cloud masking settings
Parcel data input (shape file)
Band selection
Time interval selection
Output image properties
Main processing loop For each parcel:
Sentinel-2 processing
get and download SCL imagettes
create a list tiles to be downloaded (based on cloud cover)
get and download band imagettes
merge bands and apply stretching
create calendar views
generetes derived products: NDVI profiles, histograms, Red-NIR scatter plots, …
Sentinel-1 processing
get and download Sentinel-1 backscattering imagettes
rescale and stretch imagettes
for each polarization (VV and VH) and for the two orientations (D and A)
provide calendar views
compute statistics
plot joint profiles
3.1 Initialization
The variables in the initialization part of the script allows one to define inputs and outputs and to customize the different operations performed by the script.
Authentication and data access
These scripts are using RESTful API for CbM. See the documentation on how to “Build RESTful API with Flask for CbM”. To access the RESTful services it is necessary to provide login information. In this respect, the username, password and the data url (url_base variable) have to be properly configured. Alternatively JRC’s RESTful API for CbM provides limited sample open datasets and can be used for testing and demonstration purposes. A temporary account can be requested from JRC GTCAP group.
Cloud categories
Different SCL classes can be specified in the cloud_categories list. These classes, mainly specifying cloud types, are used to filter out Sentinel-2 images affected by cloud covers within the parcel.
Parcel data
The parcel data including polygons, parcel IDs and crop types, are specified through the vector_file_name variable. This variable should point to the ESRI shape file containing all the needed information. The variables parcel_id_column and crop_name_column specify the columns in the shape file containing the parcel IDs and crop names. This information will be printed on the images generated by the script. In case crop name is not available add any other information in that column (can be even an empty string) you want to be printed on the outputs.
Sentinel-2 imagettes
The bands and the maximum size of the Sentinel-2 imagettes are specified through the bands and chipsize variables. Default chip size is replaced by the maximum extent of the parcel plus the buffer size provided in buffer_size_meter variable.
Date range The date range for the data search can be set through the search_window_start_date and search_window_end_date variables.
3.2 Main Processing Loop
The different operations performed in the main loop are listed in the second part of the “Overall structure of the run_calendar_view script” section above These operations are performed through the functions called in Figure 1. While the run_calendar_view script demonstrates most of the functionalities implemented in the different libraries, the main loop has a modular structure and functions can be commented if specific operations are not needed.
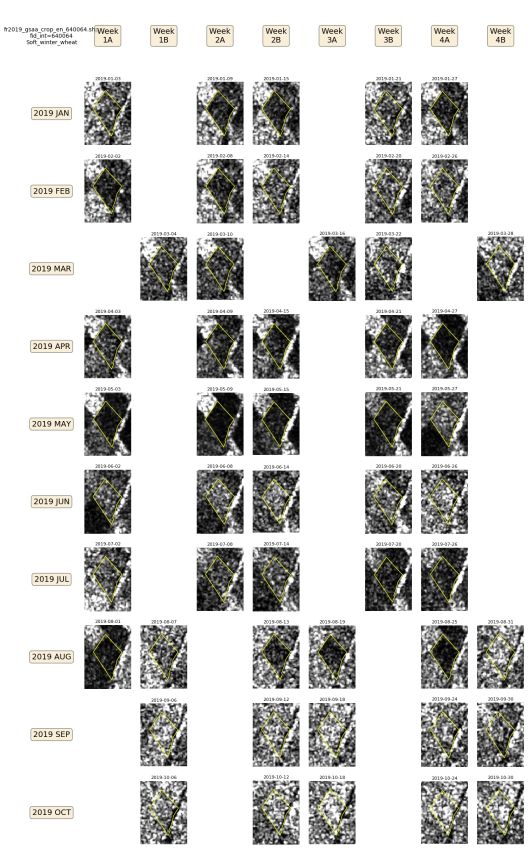
3.3 Output examples
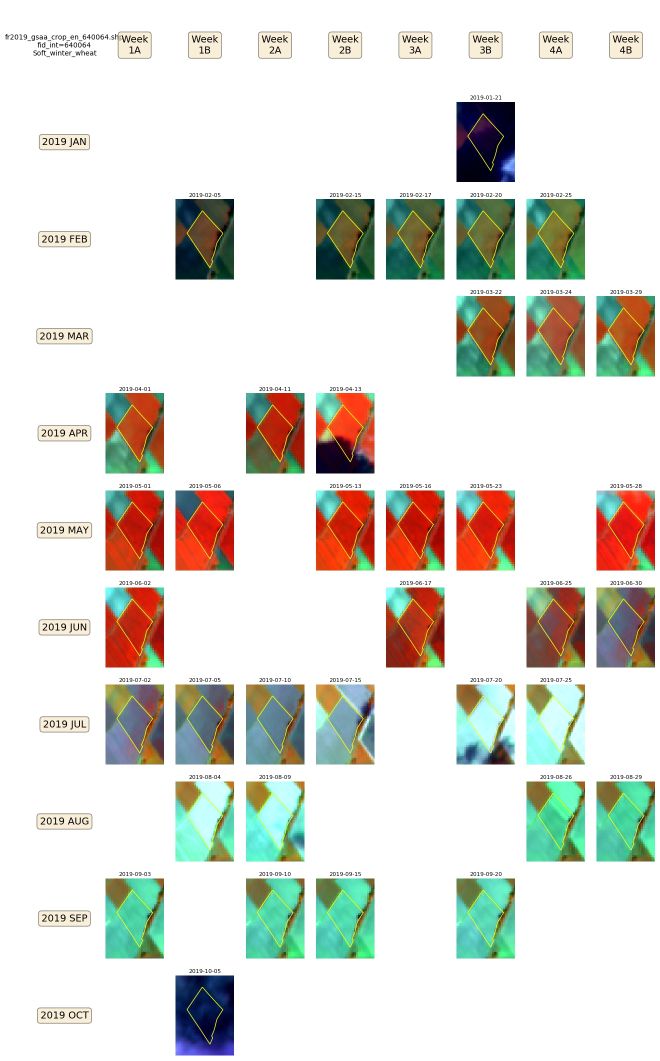
Calendar view of Sentinel-2 imagettes
False Colour Composite (FCC), 8,11,4 RGB, LUT stretched (generic)
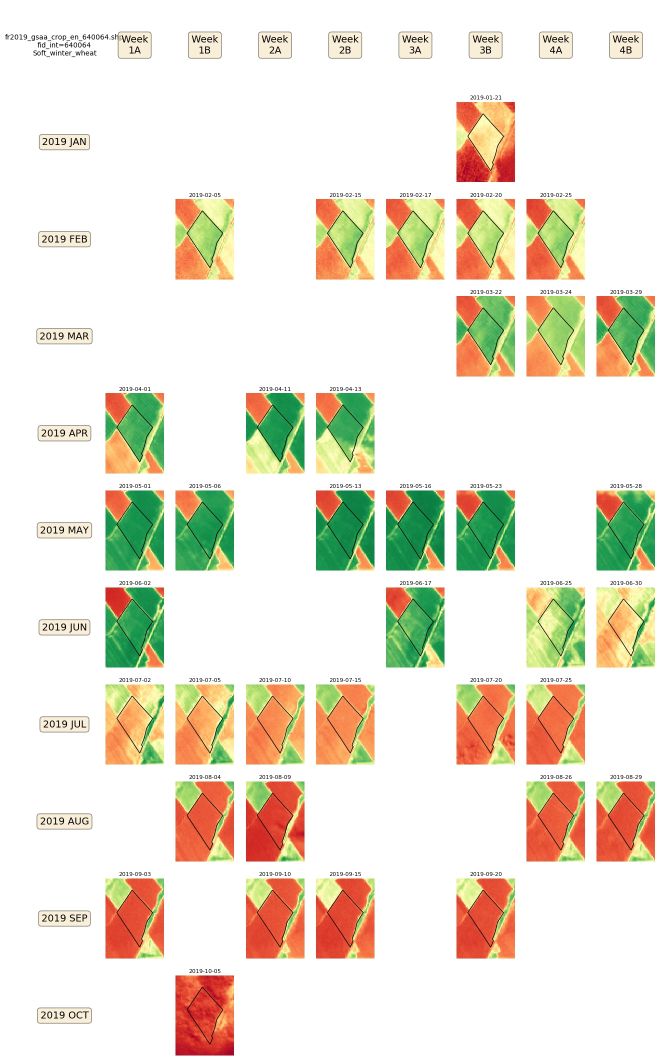
Calendar view of Sentinel-2 NDVI imagettes
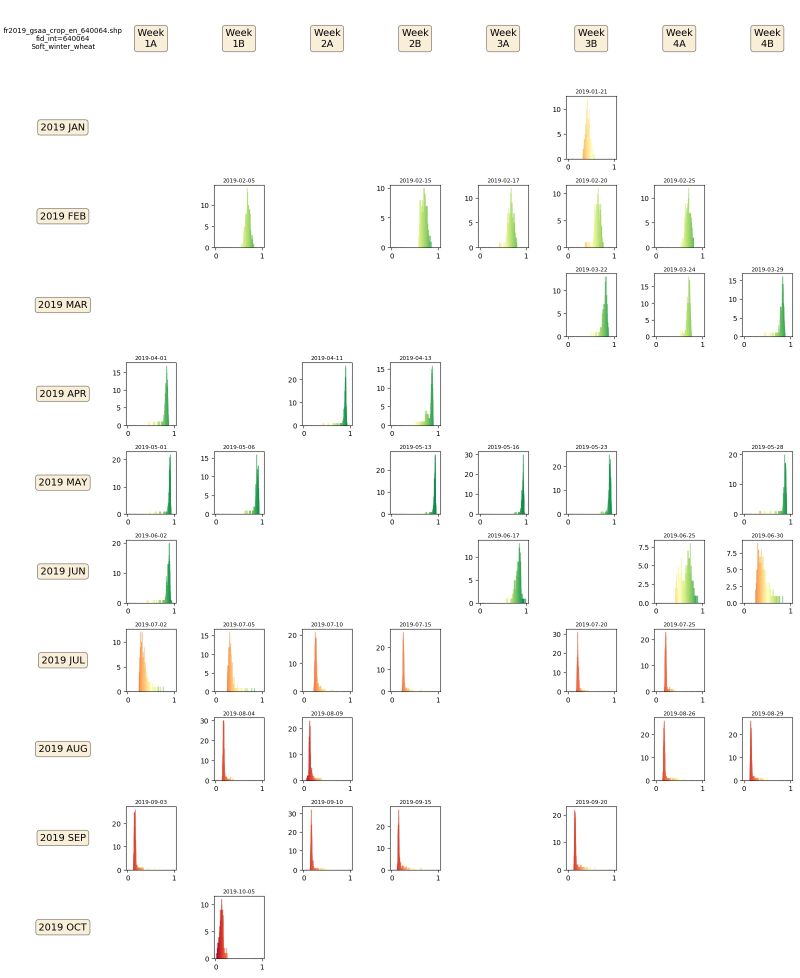
Calendar view of Sentinel-2 NDVI histograms
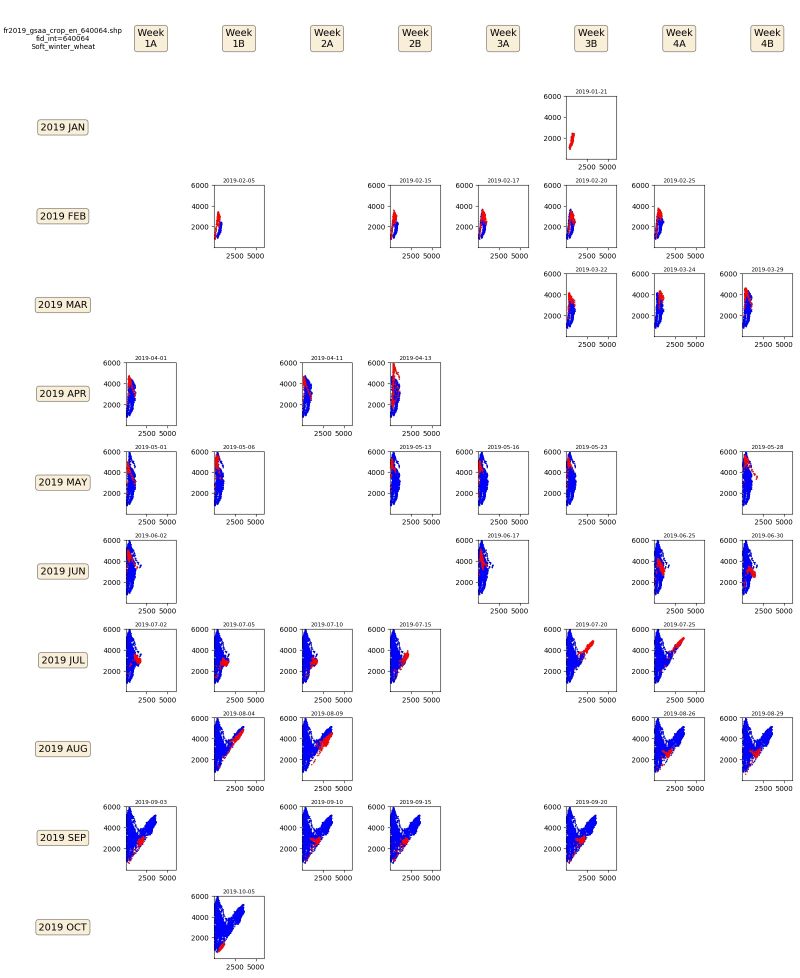
Calendar view of Sentinel-2 cumulative scatterplots
Cumulative scatter plot of Red (horizontal axis) and NIR (vertical axis) bands within the parcel Red dots: scatter plot of current date Blue dots: scatter plot of all previous dates
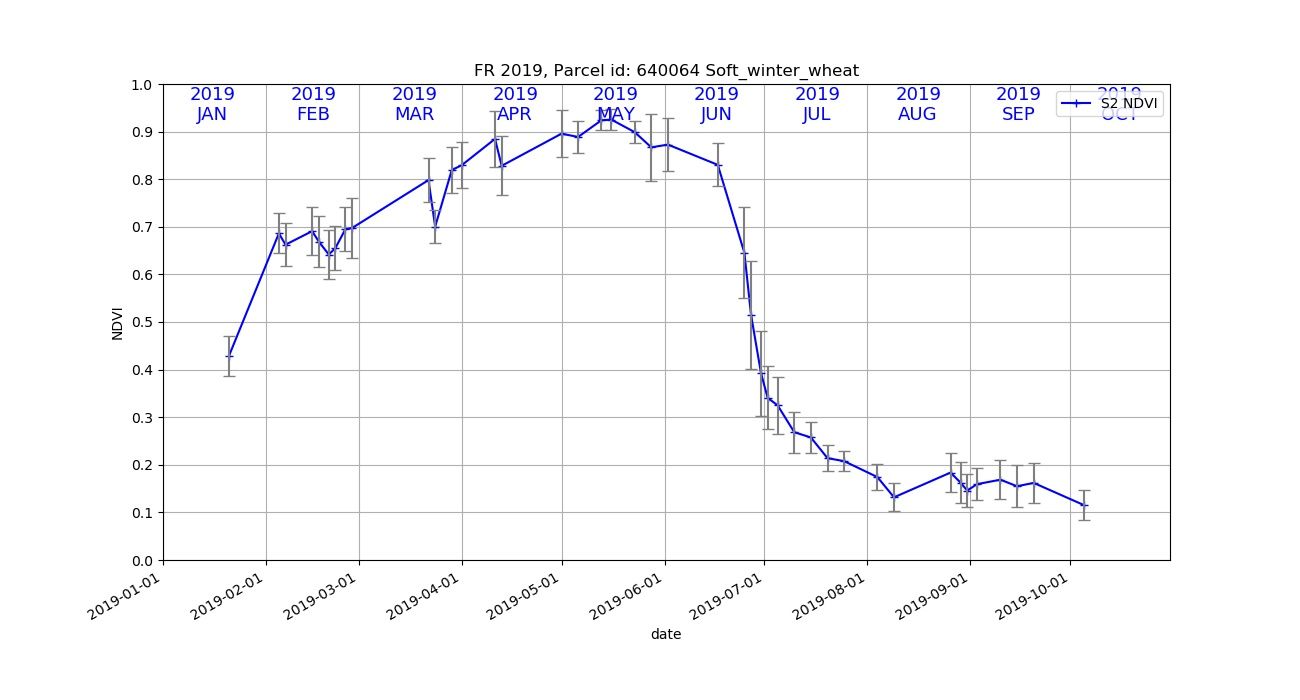
Graph of Sentinel-2 NDVI values
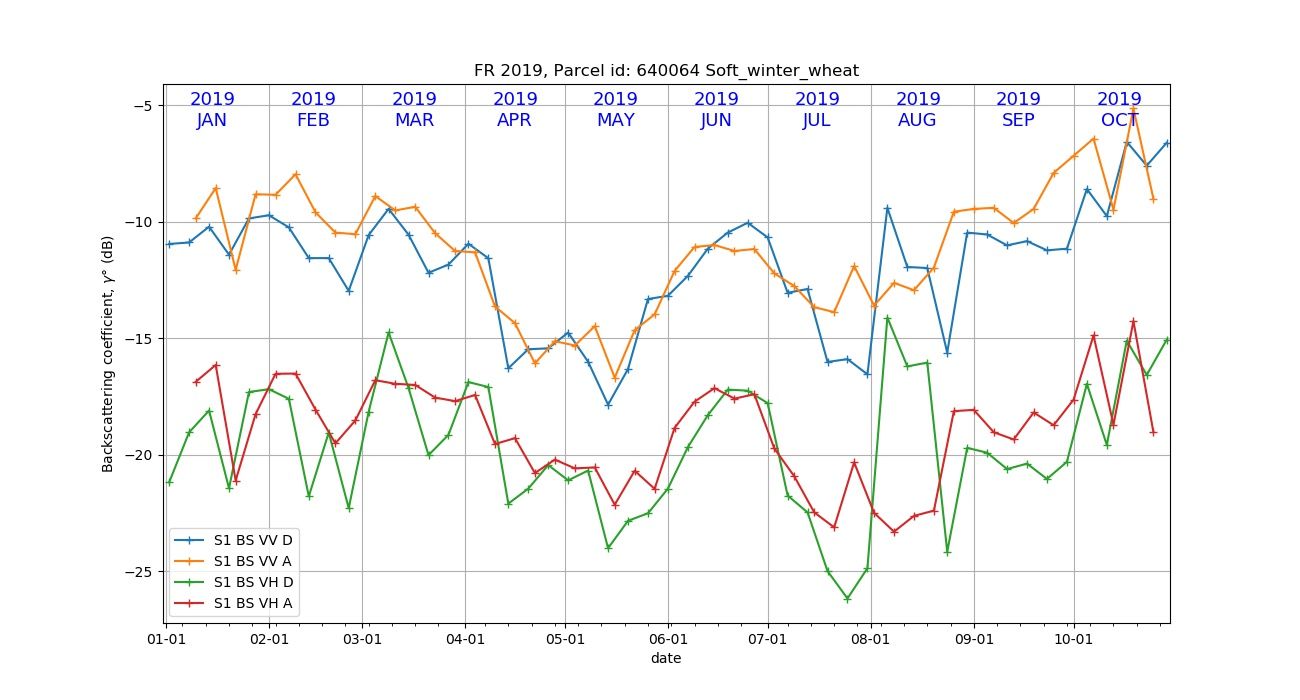
Graph of Sentinel-1 backscatter values
Calendar view of Sentinel-1 backscatter imagettes, VH polarisation, Ascending orbit
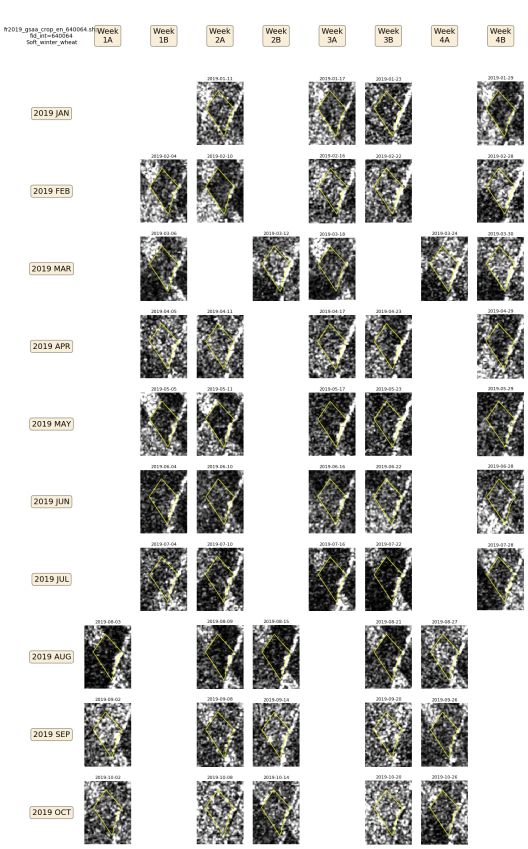
Calendar view of Sentinel-1 backscatter imagettes, VH polarisation, Descending orbit

Calendar view of Sentinel-1 backscatter imagettes, VV polarisation, Ascending orbit
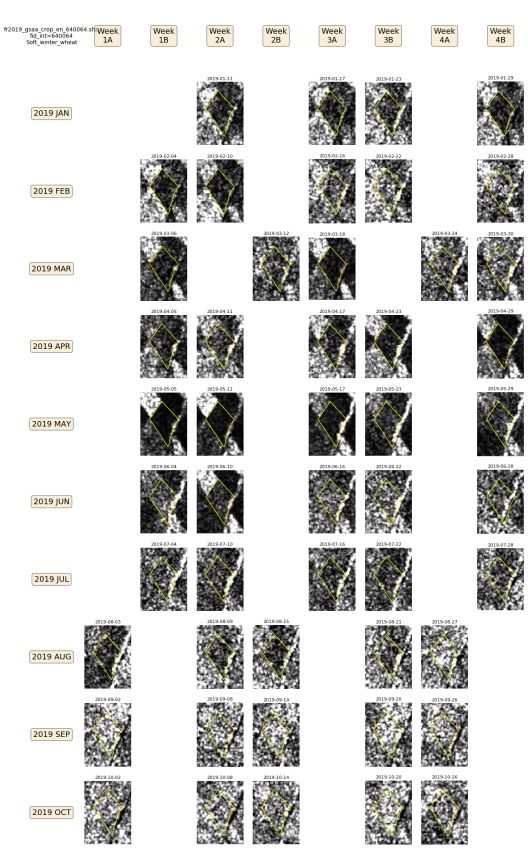
Calendar view of Sentinel-1 backscatter imagettes, VV polarisation, Descending orbit