FOI examples
FOI Assessment: Heterogeneity and Cardinality
The FOI assessment python package is based on the principle that inside of a homogenous FOI there should be only one type of land use on the same type of land cover; thus, if we apply a given image classification technique on Sentinel data, it would label the pixels to the same class value. In the same manner, a FOI which respects the 1-1 cardinality should not include clusters of pixels, labelled with different class values, larger than a specified threshold (we can consider dispersed pixels labelled differently than the main class value as “noise”).
The FOI Assessment performs a spatial analysis on such “thematic raster” produced in advance. The thematic raster can be the result of any image/raster processing method yielding a class label for each pixel - supervised (land cover/crop) classification, unsupervised clustering based on the behavior of land phenomenon, gridded data on any terrain characteristics, such as soil type, slope, hydrology, etc.
As an example, if the thematic raster is the result of a crop classification, a homogeneous FOI should enclose only pixels with class value (or label) that represent the respective crop; a spatially congruent (1-1 cardinality) FOI should not include any cluster of pixels from other class label larger than a specified threshold (for example, expressed as maximum number of pixels in the cluster). If the thematic raster is the result of a unsupervised behavior analysis, all the pixels inside an FOI should be labeled with the value corresponding to a particular behavior during a pre-defined period of time.For both heterogeneity and cardinality, the python package provides two methods for the analysis: one based area calculation (version 1) and one based on cluster size calculation (version 2). Both methods yield similar results.
To run the FOI functions the configuration file need to be set, see `CbM Package Configuration <https://jrc-cbm.readthedocs.io/en/latest/cbm_config.html>`_ for more details.
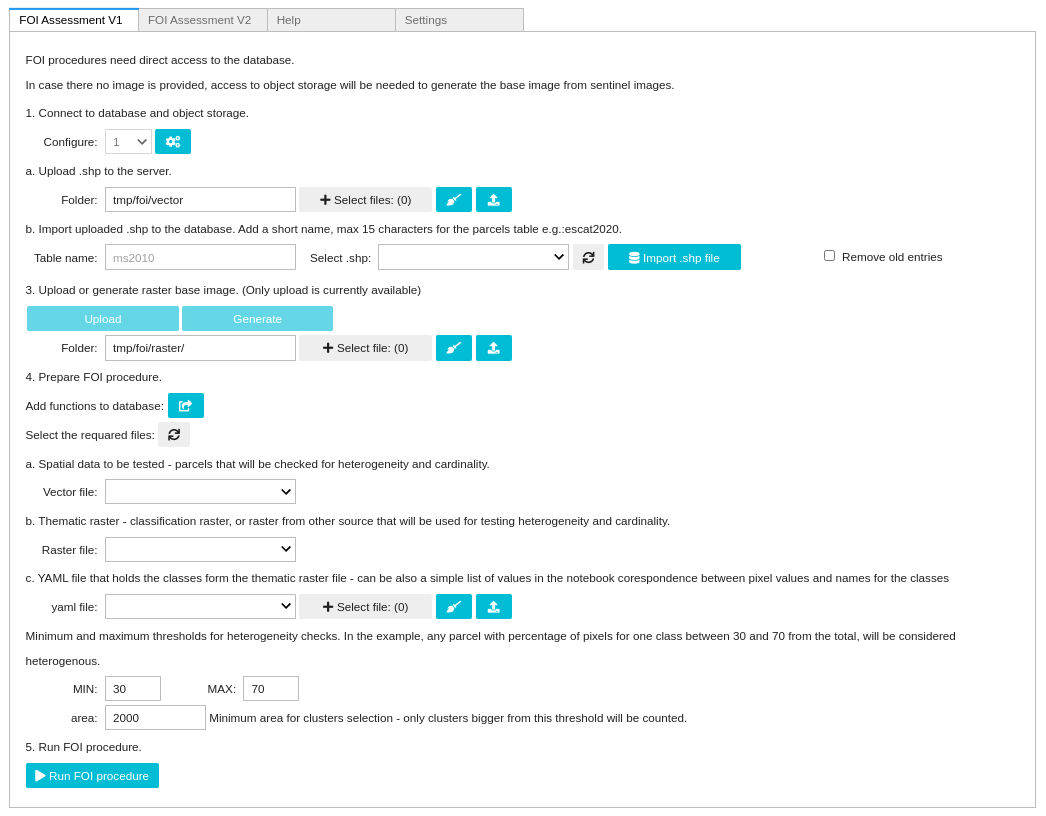
Version 1
The first version requires the connection to a database server (PostgreSQL >v12 with PostGIS extension). For the heterogeneity analysis the following steps are required.
Connect to the database (at the moment only “Database connection settings” are required)
Upload the reference data shapefile to the server.
Import uploaded shapefile to the database, specifying the name for the table that will be created in the database.
Upload the “thematic raster”. The accepted files are tif or tiff files. The thematic raster should be a one band raster file, with the pixel values representing the class labels (representing land cover, crop type or type of behaviour)
Create the necessary function and stored procedures on the database server.
Select the required files for analysis
Vector file: the data containing the FOI geometries on which the analysis will be applied. In case that we have more shapefiles uploaded on the server, this functionality allows us to select the one that we want to analyze.
#. Thematic raster: the thematic raster provided. In case that we have more rasters uploaded on the server, this functionality allows us to select the one that we want to use on the analysis. #.
YAML file that holds the classes form the thematic raster file: this file specifies the classes of pixels from the thematic raster and can also provide the meaning of those classes. It should have the following structure:
example.yml
category_map:
 0: Unclassified
 1: Class1
 2: Class2
 3: Class3
 4: Class4
 5: Class5
 6: Class6
 7: Class7
 8: Class8
 9: Class9
 10: Class10
Class1, Class2, Class_n can be replaced by the meaning of the class (like Wheat, Maize, etc. or by behavior name or any other). The YAML file should include all the classes that exist in the thematic raster.
Analysis parameters: Heterogeneity thresholds: in order to exclude the influence of „noise” pixels, the user can specify the heterogeneity thresholds. For example, only the FOIs where one class of pixels have a percentage between 30 and 70 is considered heterogeneous (this implies that the remaining pixels are labelled with different class). Minimum area for clusters selection: the user can specify the minimum area of the cluster that are considered a cardinality issue, in square meters. Of example the clusters smaller than 2000 square meters can be considered as not influencing the FOI cardinality.
Run the FOI analysis.
The result of the analysis is represented by three shapefiles that are stored on the “output_data” folder (/cbm/tmp/foi/output_data).
“name of the shapefile dataset” (without extension) that needs to be tested + foih_v1.shp – represents the initial shapefile and during the analysis the following attributes are added:
foi_h – heterogeneity flag (0 for homogeneous FOIs and 1 for heterogeneous FOIs)
number of pixels for each class (the name of the attribute is the name of the class)
total number of pixel for the respective FOI
percentage of pixels from each class (number of pixels for each class / total number of pixels inside the FOI)
“name of the shapefile dataset” (without extension) that needs to be tested + foic_v1.shp - represents the initial shapefile and during the analysis the following attributes are added:
foi_c – cardinality flag (0 for FOIs respecting the 1-1 cardinality and 1 for FOIs not respecting the 1-1 cardinality). As a result of this analysis, the FOIs that include more than one cluster of pixel from different classes bigger than the threshold are considered not respecting 1-1 cardinality. For example a FOI that includes two clusters of pixels from different classes (arable land and non-agricultural area), each of the clusters bigger than the threshold (ex. 2000 square meters), is considered as not respecting the 1-1 cardinality.
“name of the shapefile dataset” (without extension) that needs to be tested + foic_clusters_v1.shp – represents only the clusters of pixels that are defining the FOI cardinality (for example if an FOI includes three clusters of pixels bigger that the threshold, only those clusters will be saved in this shapefile)
Code non interactive
import cbm

vector_file = “data/parcels2020.shp”
raster_file = “data/raster.tif”
yaml_file = “data/pixelvalues_classes.yml”
pre_min_het = 30
pre_max_het = 70
area_threshold = 2000

cbm.foi.v1(vector_file, raster_file, yaml_file,
    pre_min_het, pre_max_het, area_threshold)
Interactive Jupyter Notebook widget
The subpackage ipycbm.foi() provides a graphical interface for the required steps.
from cbm import ipycbm
ipycbm.foi()
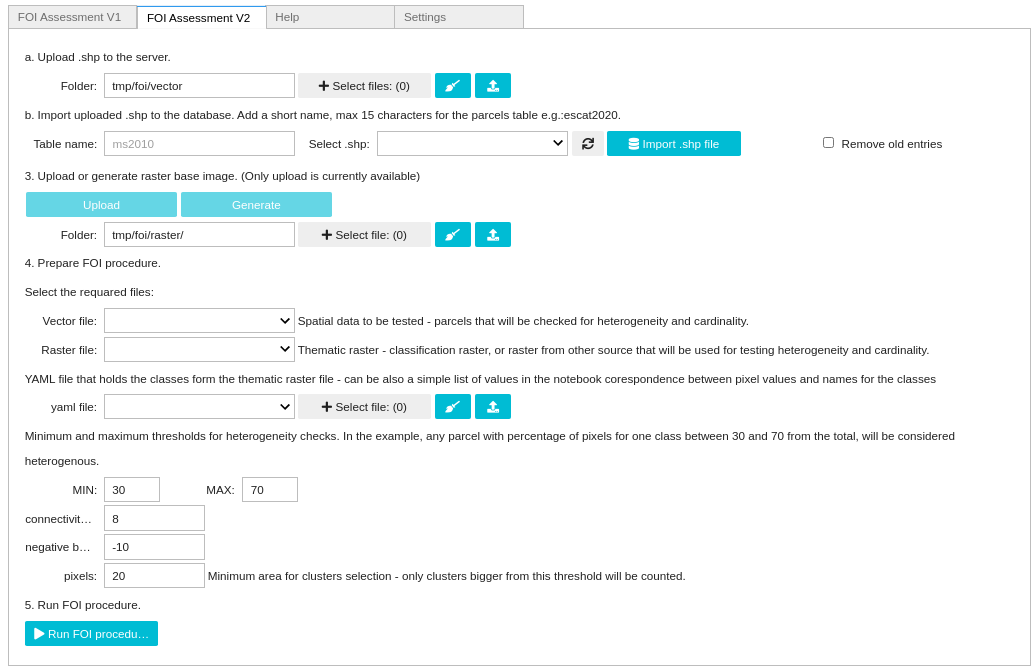
Version 2
The second version does not require a database server. All the calculations are made directly at pixel level using Python function (without the creation of intermediate vectors for the area calculation). The interface and the steps are similar to the ones from the Version 1. The main difference is that it does not include the functionality for database connection and creating the functions on the database server.
The different options available:
Connectivity type: 8 or 4 connected pixels with the same class label (4 indicating that diagonal pixels are not considered directly adjacent for polygon membership purposes or 8 indicating they are) Negative buffer: user can apply a negative buffer on the FOI in order to reduce in the analysis, the role of the pixels located at the boundary (assumed influenced by roads, adjacent FOIs, etc.) Cluster size (in pixels): the minimum number of pixels with the same class label in cluster, in order to be taken into account in the cardinality check.
The result of the analysis is represented by two shapefiles that are stored on the “output_data” folder (/cbm/data/foi/output_data). Name of the shapefile dataset (without extension) that needs to be tested + foih_v2.shp – represents the initial shapefile and during the analysis the following attributes are added:
foi_h – heterogeneity flag (0 for homogeneous FOIs and 1 for heterogeneous FOIs)
number of pixels for each class (the name of the attribute is the name of the class)
total number of pixel for the respective FOI
percentage of pixels from each class (number of pixels for each class / total number of pixels inside the FOI) name of the shapefile dataset (without extension) that needs to be tested + foic_v2.shp - represents the initial shapefile and during the analysis the following attributes are added:
foi_c – cardinality flag (0 for FOIs respecting the 1-1 cardinality and 1 for FOIs not respecting the 1-1 cardinality). As a result of this analysis, the FOIs that include more than one cluster of pixels from different classes bigger than the threshold are considered not respecting the 1-1 cardinality. For example and FOI that includes two clusters of pixels from different classes (arable land and non-agricultural area), each of the clusters bigger than the threshold (ex. 20 pixels), is considered as not respecting the 1-1 cardinality.
Clusters – the information about the clusters of pixels identified inside the FOI, as pair of pixel class and cluster size: for example (3, 25), (5, 120) means that inside the FOI we have identified two clusters: one of pixels from class 3 and the cluster size is 25 pixels and another one with pixels of class 5 and cluster size 120 pixels.
Code non interactive
import cbm

vector_file = “data/parcels.shp”
raster_file = “data/raster.tif”
yaml_file = “data/pixelvalues_classes.yml”
negative_buffer = -10
min_heterogeneity_threshold = 30
max_heterogeneity_threshold = 70
connectivity_option = 8
cluster_threshold = 20

cbm.foi.v2(vector_file, raster_file, yaml_file, negative_buffer, min_heterogeneity_threshold,
    max_heterogeneity_threshold, connectivity_option, cluster_threshold)
Interactive Jupyter Notebook widget
The subpackage ipycbm.foi() provides a graphical interface for the required steps.
from cbm import ipycbm
ipycbm.foi()